Experience with a computed radiograpic mammography system and comparison with other systems
Figures Page


Figure 1. (A) This prototype digital mammography system that used the Fuji 5000MA CR
imager and reader (FUJIFILM Medical Systems USA, Inc., Stamford, CT) was used by the
University of California, Davis during the Digital Mammographic Imaging Screening Trial
(DMIST). (B) Computed radiography mammography uses a photostimulable storage phosphor
(PSP) plate in a conventional cassette form-factor to record the X-ray signals transmitted
through the breast. Essentially, any dedicated mammography system accredited for screen-
film mammography can become Ňdigital.Ó Additionally, flexibility is achieved (as it is in filmscreen
mammography) through the option of 2 different detector sizes so that a particular
breast size can be better matched.
|


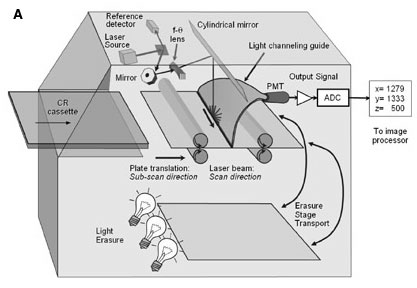
Figure 2. (A) The exposed computed radiography (CR) imaging plate is placed into a special
CR mammography reader, is transported to an optical reading stage, and is scanned with a
stimulating laser beam to produce photostimulated luminescence (PSL) that sweeps the
extracted imaging plate. The PSL signal, proportional to the incident X-ray intensity on the
imaging plate, is captured by a light guide, channeled to a photomultiplier tube (PMT), converted
to an electronic signal, and amplified. An analog-to-digital converter (ADC) subsequently
transforms the electronic signal amplitude into an equivalent digital number that is
placed in the digital image matrix corresponding to the position of the laser beam at that
instant. Scanning occurs in a raster fashion by transporting the plate continuously through the
optical stage. Laser scanning occurs very quickly, from left to right, and plate translation speed
is coordinated to ensure the same sampling pitch (space between pixels) in the rows and
columns of the digital image. Once the imaging plate is scanned, an erasure step eliminates
residual signal, and the refreshed imaging plate is ready for another exposure. (B) For dedicated
mammography, a specialized Ňdual-sided readoutÓ and 50-µm sampling pitch is
employed to optimize detection and readout efficiency of the imaging process. There are differences
in the characteristics of the information acquired from the front and back light guides.
Sophisticated signal processing algorithms are applied to the separate signals to optimize the
characteristics of spatial resolution and contrast resolution, which are then combined at the
image processor to produce the final output image.
|


Figure 3. (A) The modulation transfer function (MTF) illustrates how information is lost as a
function of spatial frequency (inverse of object size). A perfect system would deliver 100% modulation
for all spatial frequencies. The cutoff frequency (maximum spatial frequency contained
in a signal averaged over an area) for a 50-µm element size is 20 line pairs per mm (lp/mm).
Depending on the sampling pitch (distance between sample areas) the Nyquist frequency
(maximum useful frequency) when the sampling pitch equals the aperture dimension (the situation
for most digital detectors) is equal to half the cutoff frequency (known as the Nyquist sampling
theorem), meaning that 10 line pairs per mm is the maximum useable frequency in the
acquired image for a 50-µm spot dimension. (B) In reality, when one compares the measurements
of the hypothetical perfect detector with actual computed radiography measurements, it
is clear that the MTF does fall off significantly at higher spatial frequencies (smaller object size).
|
|